- Created by Miloš Zeković on 05 11, 2019
This chapter explains what is where in NetVizura NetFlow Analyzer.
To access module, click NetFlow on the Module Menu in the Top navigation bar.
User Interface
First let us define main parts of the NetFlow Analyzer user interface:
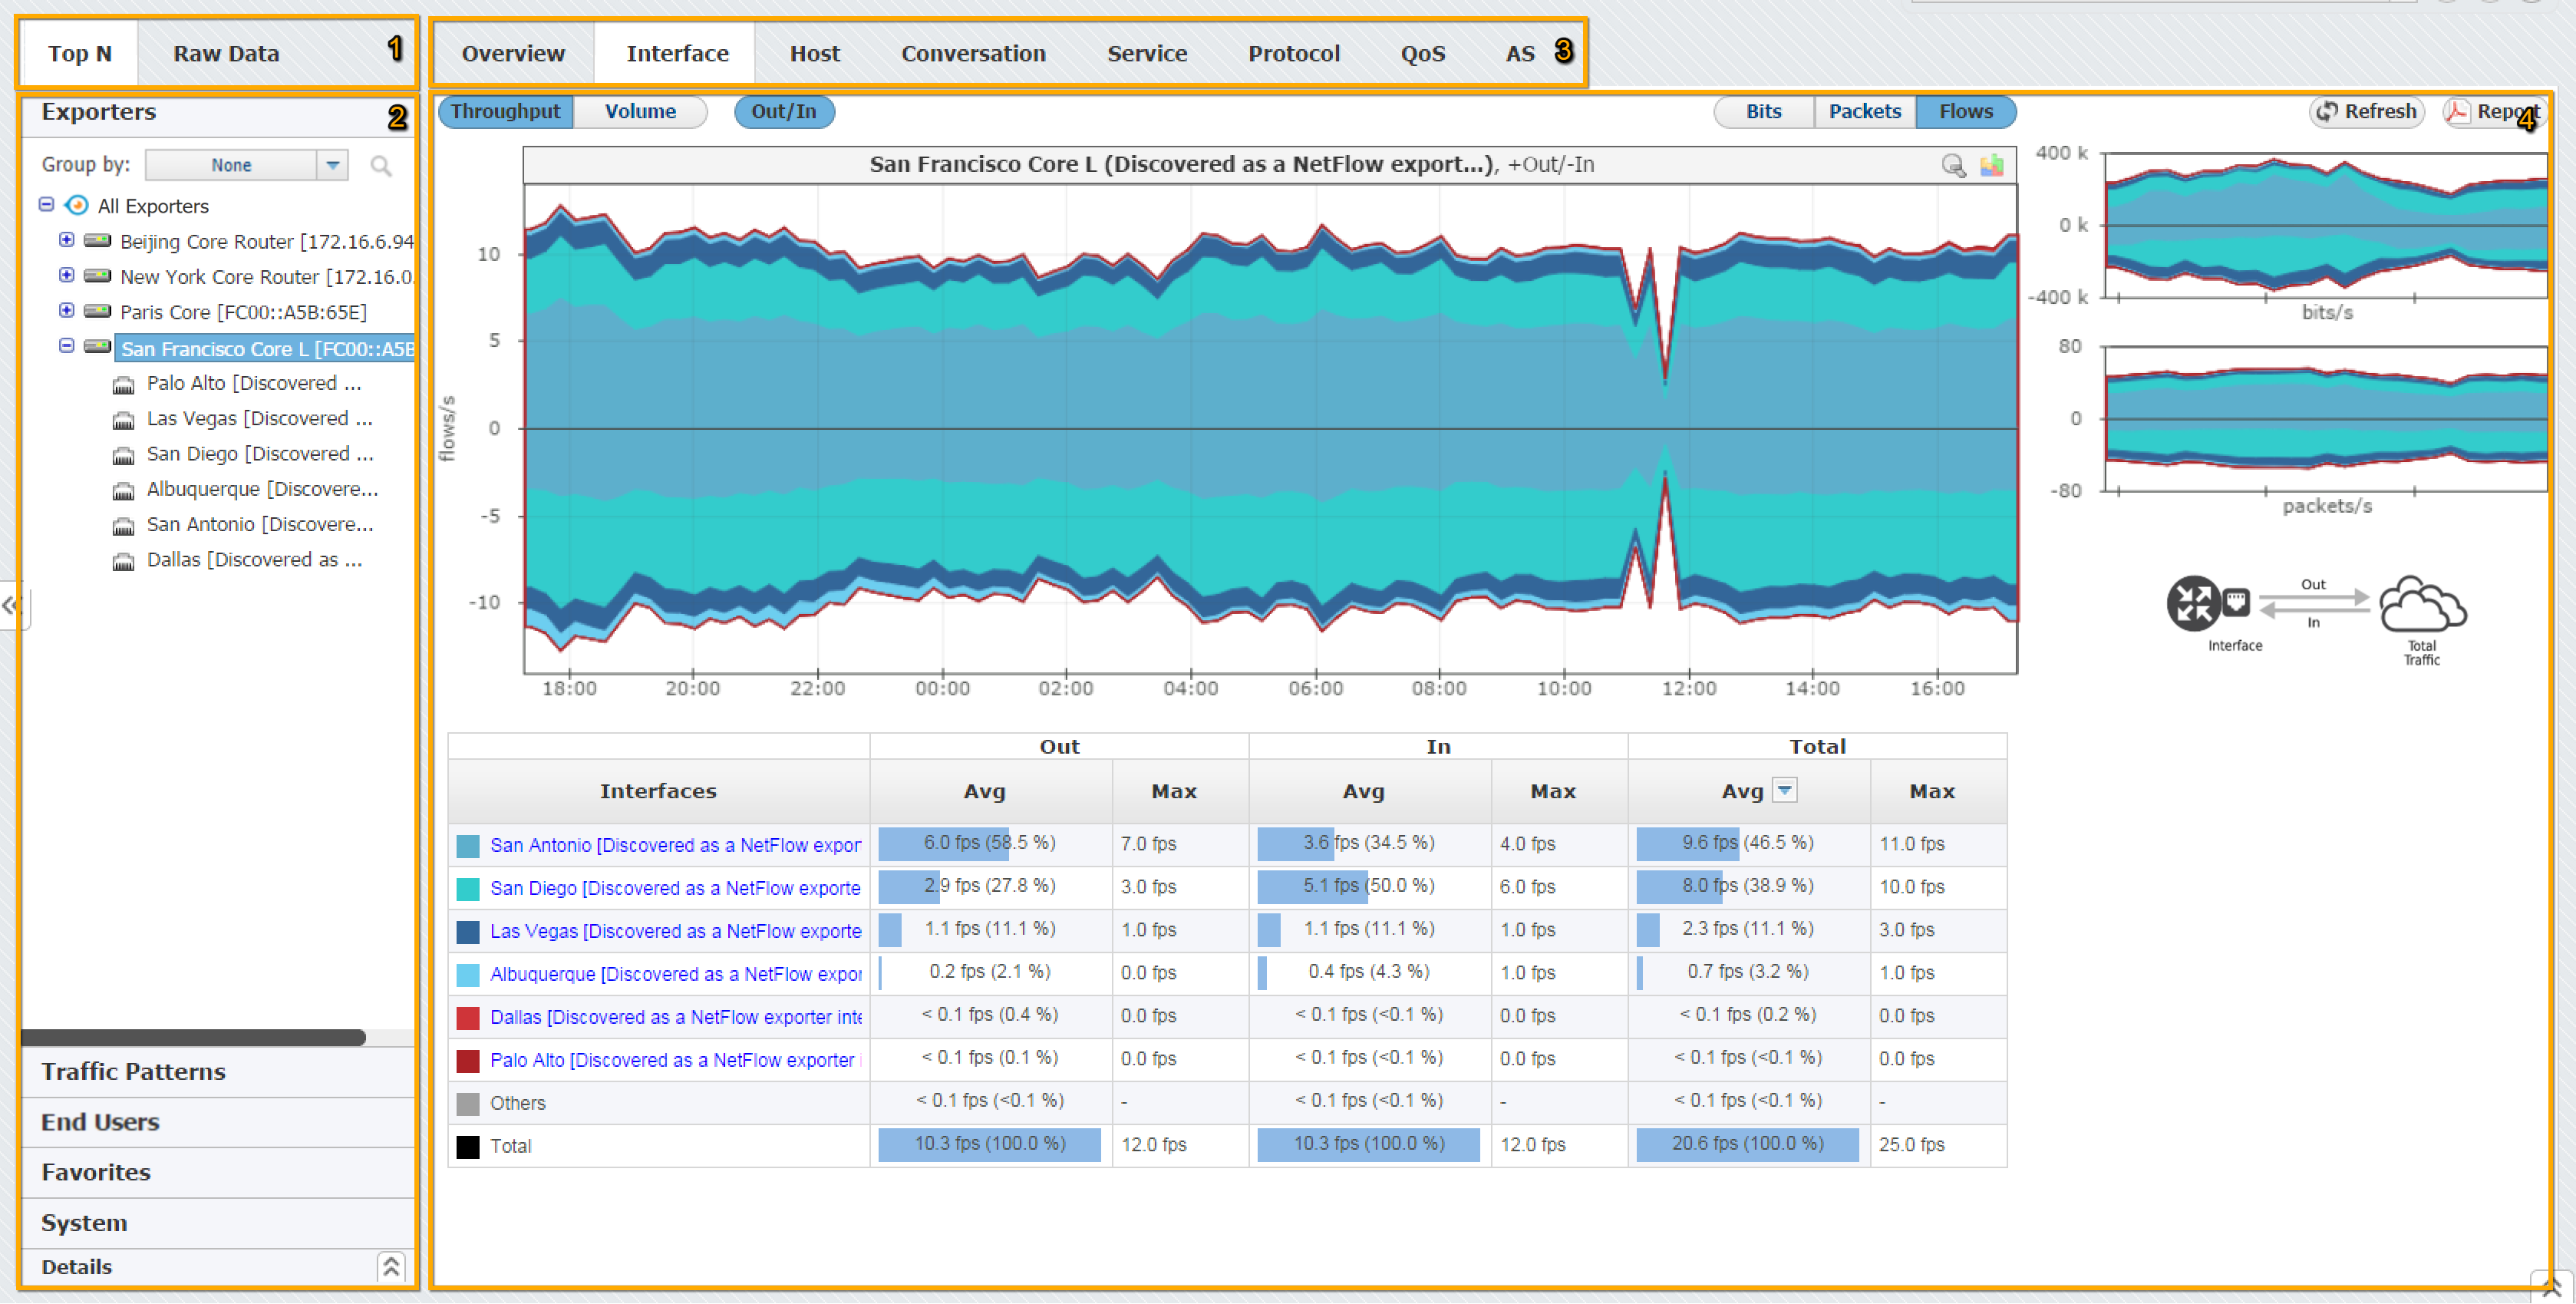
Mode Panel – choose between the TopN and Raw Data mode
Only users with NetFlow write module permission can see Raw Data mode
- Menu Panel – shows nodes depending on selected mode
- Tab Panel - shows views depending on selected mode and node
- Main Panel – shows network traffic depending on selected mode, node and view
To make navigation easier for you, several indicators (blue, white or grey) show where you are and what you are doing – which mode, node, view, filter is currently selected.

On the screenshot above you can see that the selected Mode is TopN, selected Menu option is Exporter (San Francisco is the active node), and that selected Tab options is Interface - this results in Main Panel showing the TopN interfaces for San Francisco exporter.
TopN Navigation
To access this mode, choose TopN in the Mode Panel.
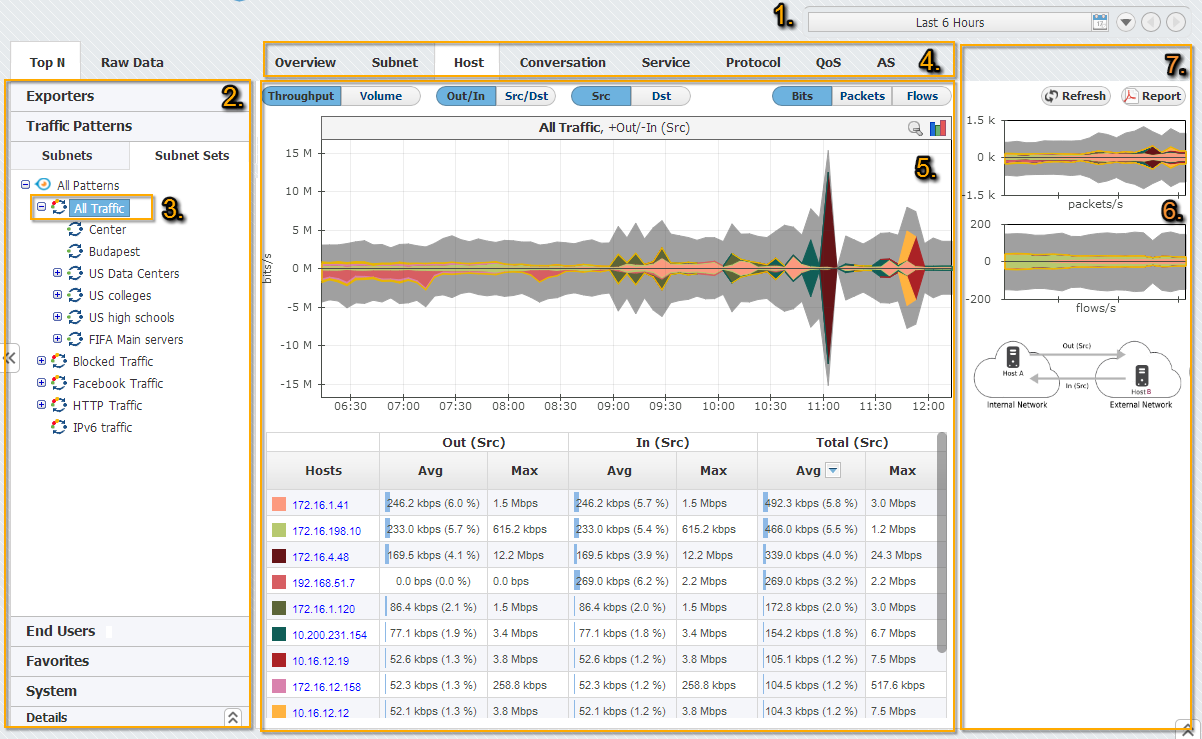
Main parts of the NetFlow TopN interface are:
Selected Time - in the Time Window applying to all views
Selected Section showing in Menu Panel:
Exporters section
Traffic Pattern section (with Subnets and Subnet Sets options)
End Users section
Favorites section
System section
Details for selected node
Selected Node - active node for which the traffic is displayed in the Main Panel
Selected View - Tab Panel showing Overview or distributions by: Subnets (Traffic Pattern view only), Interfaces (Exporter view only), Hosts, Conversations, Services, Protocols, QoS and AS
Chart and Table - Main Panel showing traffic for the selected node by selected view depending on time window
Side Charts – two small charts showing bits, packets or flows traffic
- Report - PDF export and email scheduling options

In the screenshot above you can see TopN host (4) for Traffic Pattern All Traffic (3) during last 6 hours (1). You can also see that the top host is 172.16.1.41.
Continue reading about Traffic Views.
Raw Data Navigation
By selecting the Raw Data menu option, you will be able to inspect raw data files in the Main panel.
You can also notice the Raw Data Tree right under the Raw Data menu option. Raw Data Tree groups raw data files in folders according to day/hour/minute. Note that Raw Data Tree will show raw data files for the specified time period set in time window.
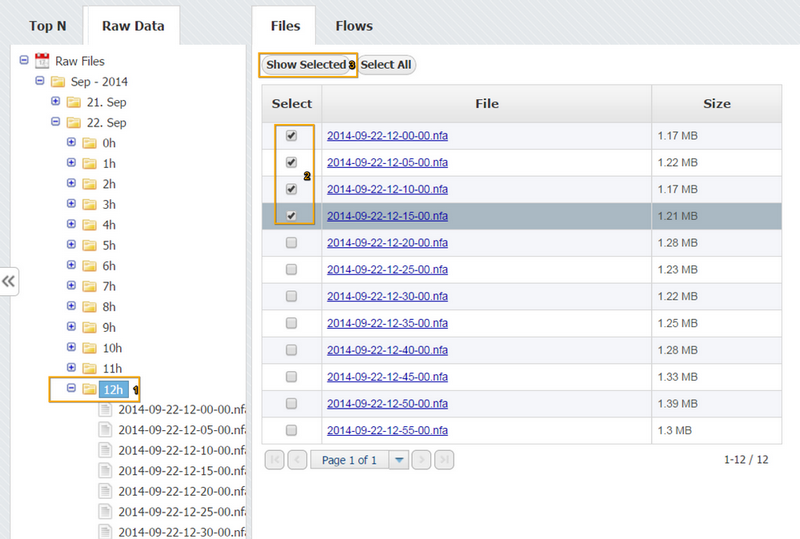
To navigate and view Raw Data from specific files:
- Select a date/time folder from the Node Tree
Select desired Raw Data files from File Table
Raw Data includes vast quantity of information about each single flow. Unpacking many files would require significant processing power and memory space, and therefore it is suggested to select and view only a few files at a time.
- Click Show Selected

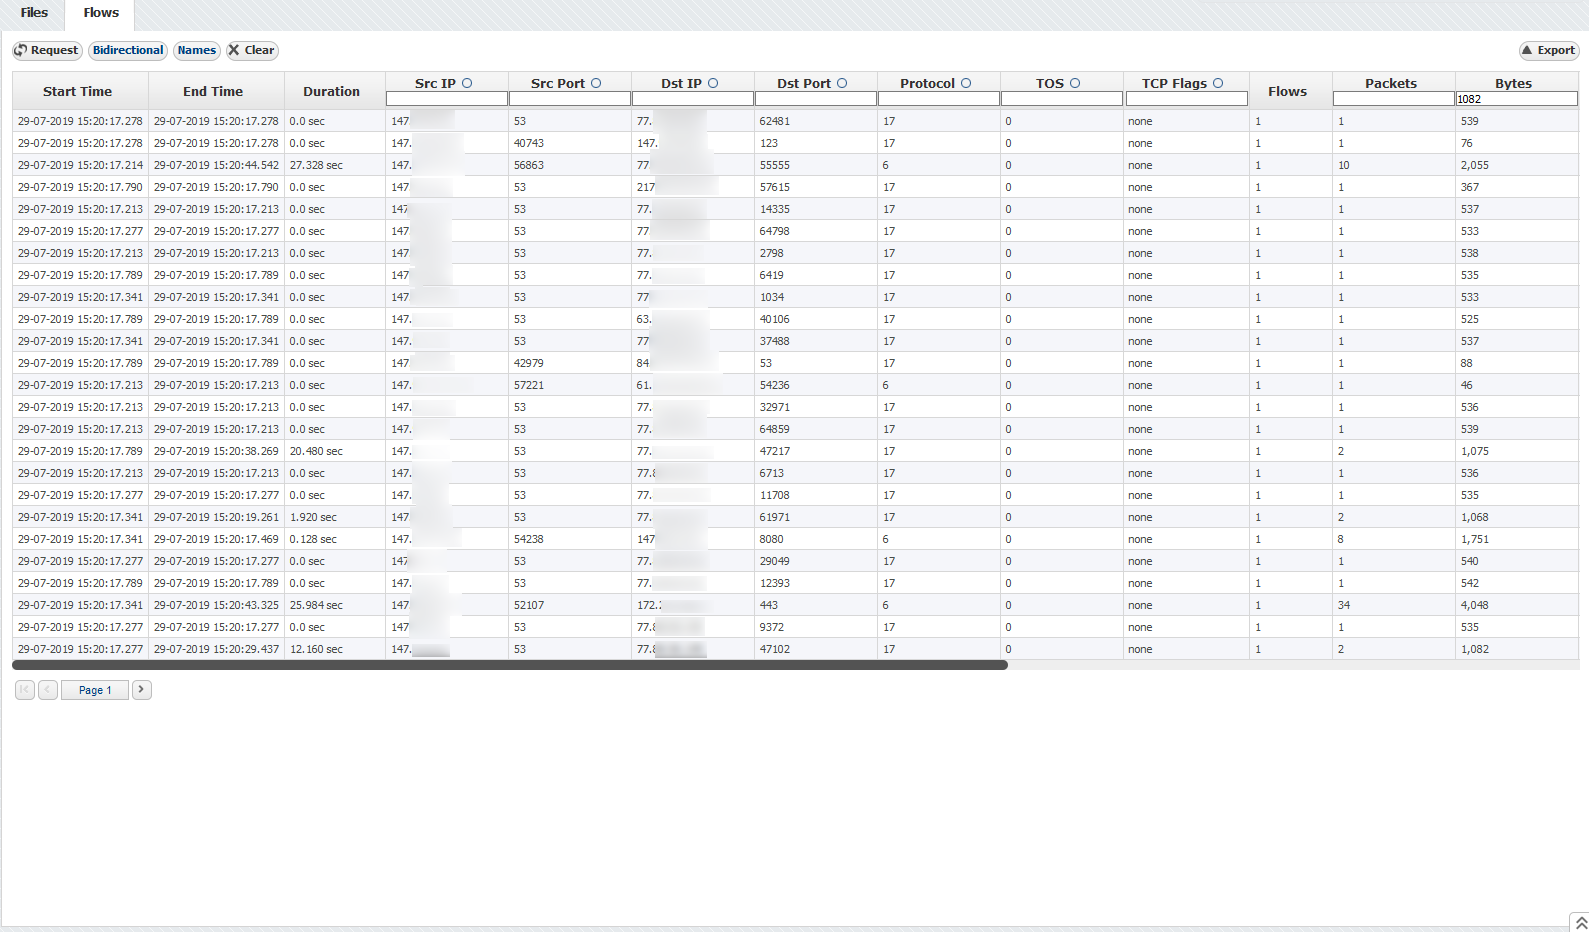
By clicking on the Show selected, Raw Data Table will open showing the information from selected raw data files.

Continue reading about Raw Data Forensics.
- No labels