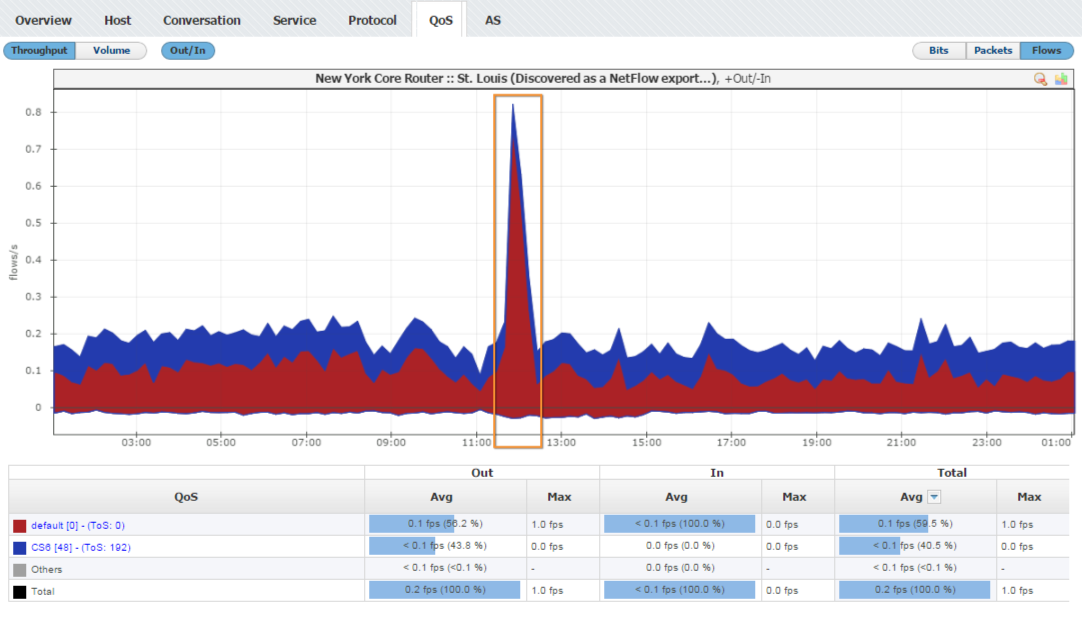
Distribution by QoS shows specific traffic in the terms of service quality. This is interesting in particular to companies that provide a QoS based service or use such services themselves.
To view traffic distribution by QoS:
- Choose a section (Exporters, Traffic Patterns or End Users) in the Menu Panel
- Select desired node in the Node Tree
- Choose QoS in the Tab panel

The screenshot above indicates two main QoS used on the New York's router's St. Louis interface - Default and CS6. It is also noted that at 12h when major increase of Default traffic occurred, CS6 traffic simultaneously experienced a significant drop.