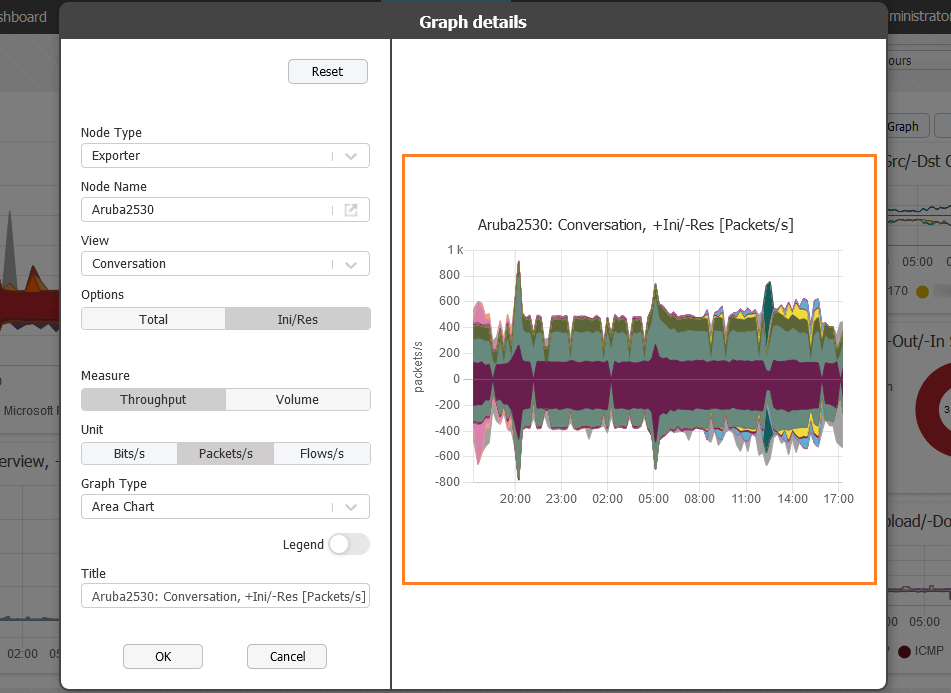
On the right side of the Add Graph and Edit Graph pop-up, you can observe the construction of the chart while in progress.
In case you go directly to Dashboard in order to create a chart, Add Graph pop-up will be blank. Once Node Type and Node Name fields are filled, the draft of the chart is going to appear. View, Options, Measure, Unit, Graph Type and Title are selected by default. Amend them in a way that serves the intended purpose of the chart. All the amendments are going to be automatically visible on the Preview field, allowing you to decide on the spot whether the made alterations enable efficient monitoring.
If you were previously browsing through the NetFlow Analyzer module, Add Graph pop-up fields are going to be populated with data of the last chart you were analyzing. In such a case, Preview field comes in handy, since it provides a glimpse of the changes you are having in mind. The same goes for the Edit Graph pop-up.