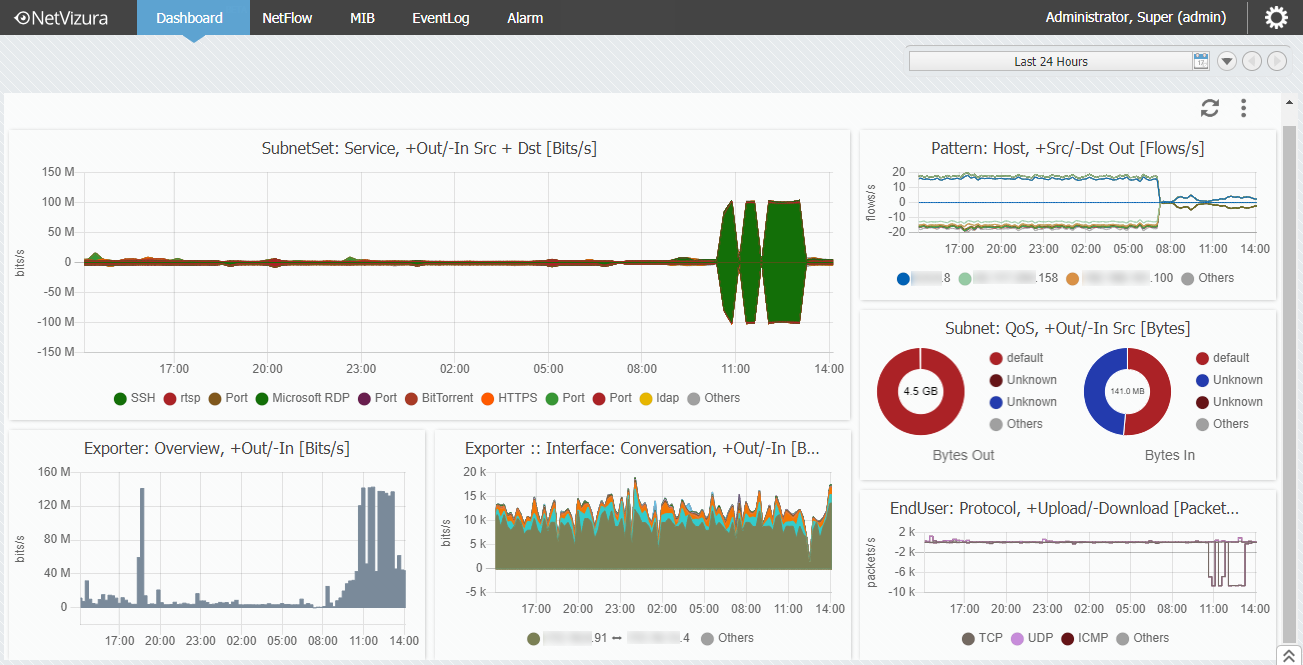
The best way to track the current state of your network is to create a customized dashboard. On this one page, you may place vital charts, order them in a manner that is the most convenient for you and use it as an overview of the most critical activities for your day-to-day work. The dashboard is amendable and at any given moment you may edit the existing charts or add the new ones.
Once you download the most recent version of NetVizura, Dashboard module would be the blank canvas on which you can insert charts by using Add Graph functionality.
Only data stored in Elasticsearch database are visible in the Dashboard module. Meaning, Dashboard cannot be used without Elasticsearch service up and running on the host, and it is enabled by default since NetVizura 5.1. To learn more on Elasticsearch, read the following page Elasticsearch.
