Severity Table
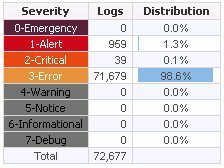
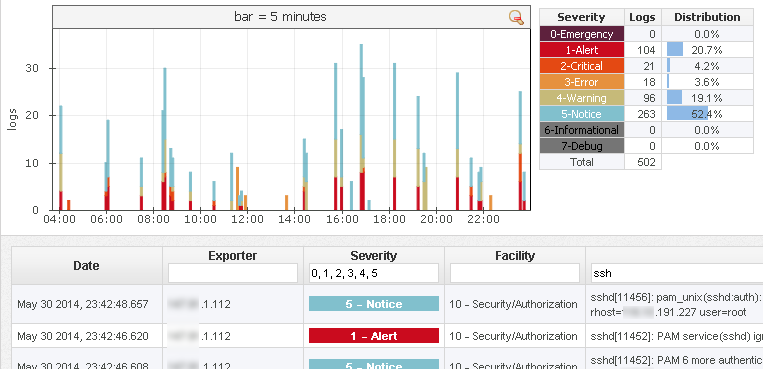
Severity Table shows log distribution by severity, for the logs of selected severity that occurred in the selected Time Window. On screenshot to the right currently selected severity levels are 0, 1, 2 and 3. This means that Syslog chart and tables will show only logs with this severity levels. By clicking on the corresponding severity in the Severity Table you can switch on/off logs of that severity. Switched off severity is shown with a gray background and logs with that severity are not shown on the carts and graphs.
Exporter Table and Chart
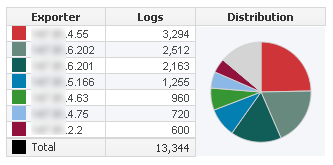
Exporter Table shows log distribution by exporter, for the logs of selected severity that occurred in the selected Time Window. Top 7 exporters have a color assigned, while other exporters are grey and under Others on the pie chart. To see other exporters, scroll down the exporter list. Clicking on an exporter will show only logs for that exporter on the charts and table. By clicking on it again, you can switch back to see logs for all exporters.
Additional Options
- Refresh Data – manually refresh data on charts and tables
- Clear filters – clear all filters
- Show Exporter Names – show names of exporters (routers) instead of their IP address. These can be DNS names, or the ones you defined in the Settings/Devices page.


