Syslog Chart

EventLog Chart shows distribution of Syslog messages (logs) by severity: 

  1. Logs per bar (y-axis)
  2. Time axis (x-axis)
  3. Bar width
  4. Zoom out

NetVizura EventLog - Syslog Chart


Chart shows number of logs in certain time chunks (1 minute, 1 day, 1 hour). Width of the chart bars and number of bars depends on the Time Window selected. See table below:
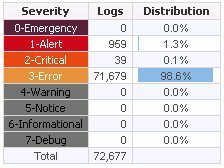

On this page:

Time WindowBar WidthNumber of Bars
Last hour30 seconds120
Last 6 hours5 minutes72
Last 12 hours5 minutes144
Last day15 minutes96
Last week1 hour168
Last month6 hours120


Chart has two axis: numerical y-axis and time x-axis. Numerical axis shows the number of logs per bar. Time shown on the x-axis of the chart is the same time as set in the Time Window. Next to the Syslog Chart is the Severity Table in which you can select if Syslog messages of the certain severity will be displayed on the chart or not. Colors on the chart correspond with the colors of the Syslog Severity in the Severity Table.

On the EventLog Chart above you can see that one bar on the chart represents logs during 30 seconds (bar = 30 seconds).


Severity Table

Severity Table shows log distribution by severity, for the logs of selected severity that occurred in the selected Time Window. On screenshot to the right currently selected severity levels are 0, 1, 2 and 3. This means that Syslog chart and tables will show only logs with this severity levels. By clicking on the corresponding severity in the Severity Table you can switch on/off logs of that severity. Switched off severity is shown with a gray background and logs with that severity are not shown on the carts and graphs.


Exporter Table and Chart


NetVizura EventLog - Exporter Table


Exporter Table shows log distribution by exporter, for the logs of selected severity that occurred in the selected Time Window. Top 7 exporters have a color assigned, while other exporters are grey and under Others on the pie chart. To see other exporters, scroll down the exporter list. Clicking on an exporter will show only logs for that exporter on the charts and table. By clicking on it again, you can switch back to see logs for all exporters.


Syslog Table

EventLog Table shows messages with selected severity (in Severity Table) that were received during time set in the Time Window. For each message Date, Exporter, Severity, Facility and Message content is displayed. Severity levels are shown with the corresponding color, as in the chart and Severity Table. Syslog Table can be filtered by Exporter, Severity, Facility and Message content. Note that the filters can be activated by selecting items in the Severity and Exporter Tables, as described above. To clear all filters, click the Clear button above the Syslog chart.
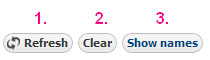

NetVizura EventLog - Syslog Table


Syslog Filtering

You can filter out unwanted logs based on log's severity, exporter, facility, date and time, and message content.

NetVizura EventLog has three main types of Syslog filters:

  • quick filters: severity and exporters

  • table filters

  • time filters (Time Window)


NetVizura EventLog - syslog filters


Quick filters are activated/deactivated by clicking on the corresponding severity in the Severity Table, or clicking on the corresponding exporter in the Exporter table. Inactive severity/exporters are marked with gray color, while active severity/exporters are colored. Logs from inactive exporters and logs with inactive severity levels are not shown in the charts and tables, and are not counted in the on-screen statistics.

Activating/deactivating severity or exporter filters will:

  • update Syslog Table filters for the corresponding exporter or severity level

  • refresh charts and Syslog Table,

  • refresh statistics in the Exporter Table and Severity Table

Filters and data in Syslog Table, Exporter Table, Severity table always match each other.

Figure 10: Using filters in Syslog Table shows Syslog Table and Severity Table, and you can see that the Severity filter in the table matches the active (colored) severity levels in the Severity Table.

Table filters are used to filter Syslog messages by log's severity, exporter, facility and message text body. To activate or change a filter simple type the value in the corresponding filter text field and press Enter. This will update the data on all chats and tables.

Multiple filter values are separated by commas.

To filter out the logs based on the time and date, change the Time Window value by clicking on it and (1) choosing a value from the drop menu or (2) selecting from and to dates in the calendar. Updating the Time Window will update the data on all chats and tables.


Additional Options

  1. Refresh Data – manually refresh data on charts and tables
  2. Clear filters – clear all filters
  3. Show Exporter Names – show names of exporters (routers) instead of their IP address.  These can be DNS names, or the ones you defined in the Settings/Devices page.