EventLog User interface
When EventLog module is selected main screen will show the following parts:
- Mode Panel - choose between the Syslog and SNMP Trap mode.
- Main Panel - displays results of SNMP request and MIB search operations.

For the purpose of this chapter, we will focus on the navigation in the Syslog mode.
Navigating in Syslog mode
To view syslog go to EventLog module and click Syslog tab. Here you can see Syslog messages sent from different exporters for a chosen Time Window.
- Show Options
- EventLog Chart
- Severity Table
- Exporter Table
- EventLog Table
Table and charts will show logs that have (1) the same severity as set in Severity Table (2) for the time set in Time Window. For these logs Exporter table will show distribution by exporters and Severity Table will show distribution by log's severity.
Active alarms for Syslog message are shown in Alarms column. Column is labeled with colour of alarm severity and number of active alarms with that severity. If there is more than one active alarm with different severities, label will be split. If there are no active alarms sign "-" is shown.
Numbers under Alarm column are clickable, and after click you will be redirected to Alarm module. There, you will be able to see the list off all active alarms within that Syslog message.
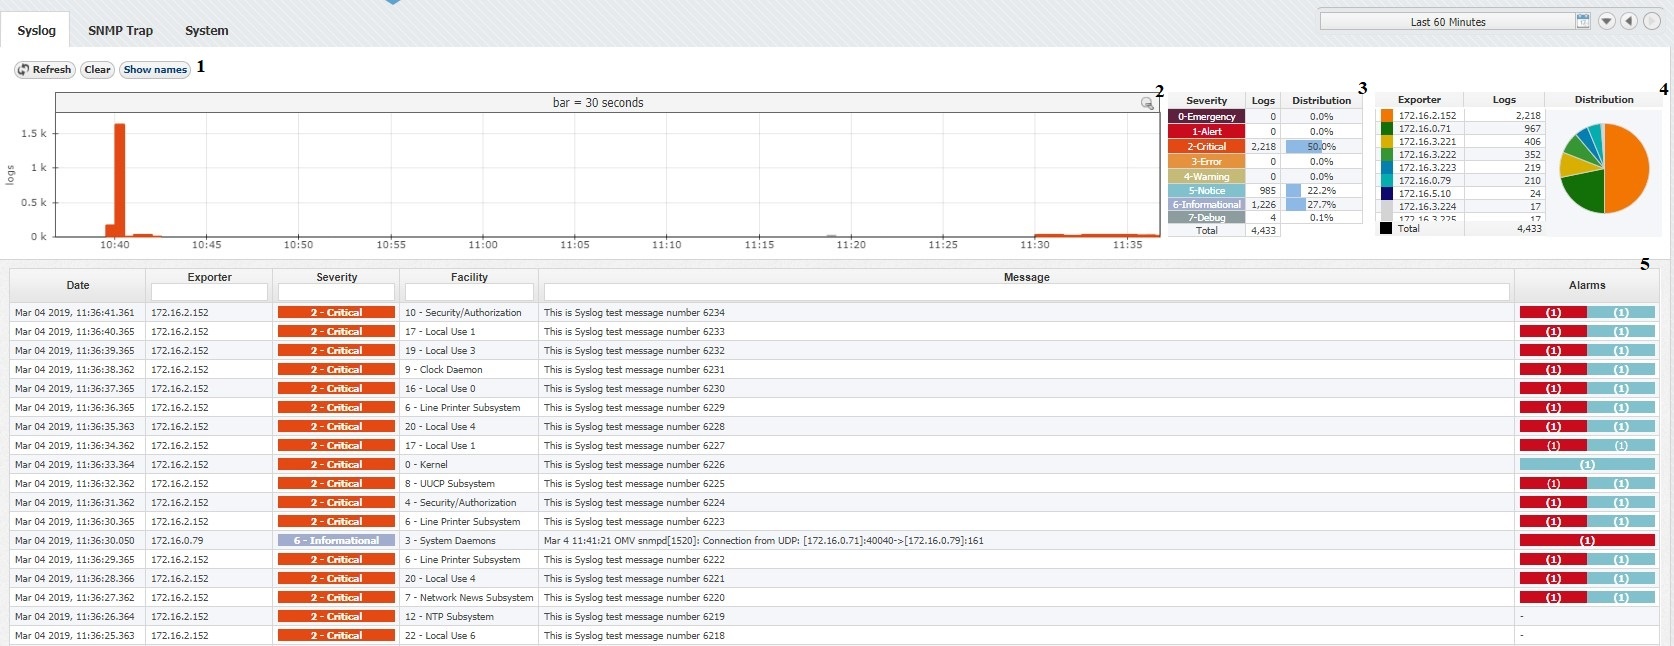
For example, on the screenshot to the left, you can see that logs that occurred during the selected Time Window and severity 0 to 7 are shown. You can also see that there was 4433 such logs (Severity Table) of which most numerous were Critical (50.0%), Informational (27.7%) and Notice (22.2%).
You can also see the distribution of these logs by exporters in the Exporter table: exporter 172.16.2.152 generated the most logs (2218).
Continue reading about Syslog Analysis.