To configure NetFlow alarms, go to ![]() > Settings > NetFlow Settings > Alarms.
> Settings > NetFlow Settings > Alarms.
To add a new alarm:
- Click Add
- Set Alarm information (name, description, level, scope, object and optionally mail-to recipients)
- Scope determines on which nodes an alarm will be applied: any or specific Exporter, Interface, Subnet, Subnet Set, Traffic Pattern or End User.
- Object determines what type of traffic will be matched against the alarm threshold criteria: total, service, protocol, host, AS, conversation and QoS.
- Recipients list (optional) determines who will receive an email when alarm triggers.
 Only users with emails associated to their user account can be recipients.
Choose between Throughput or Volume type of threshold
- Specify alarm threshold condition
Click Save
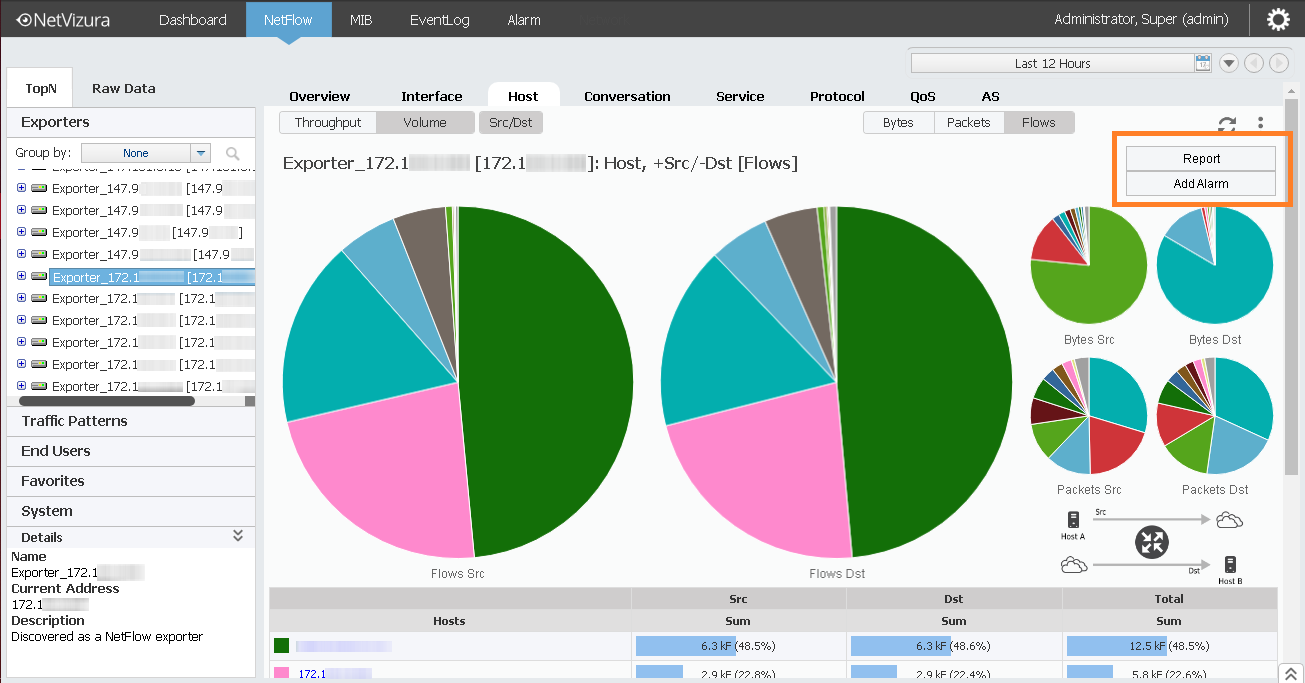
If you install NetVizura 5.x, there is a more straightforward procedure to reach Alarm Settings. Click on the vertical ellipsis symbol in the top right corner, and choose the option Add Alarm from the menu.
This will lead you to the Adding New NetFlow Alarm tab. Afterwards, follow the procedure described on this page.
Throughput Alarms
Threshold alarms are mostly used for alerting when you want to pinpoint potential problems on physical infrastructure.
They can be triggered by flows/s, packets/s or bits/s; in/out src/dst or total. It is possible to combine more threshold criteria by using AND, OR and NOT logical operators.

Screenshot above shows an example of threshold alarm. This alarms triggers if total traffic on interface Fa1 (link to Verizon) exceeds 800 Mbps. On alarm trigger an email will be sent to Super Administrator.
Volume Alarms
Volume alarms are suitable when you want to alert on atypical behavior on custom Traffic Patterns or End Users.

For example, screenshot above shows alarm made to alert Super Administrator when a user exceeds 500 MB upload to any address except specific IP range (presumably reserved for internal servers).
Please note that the 1-minute threshold condition is only available if you have set the Data aggregation interval option in Settings to 1 minute. To read more on data aggregation intervals, visit Data aggregation interval.
Alarm Examples
| Type | Alarm name | Description | |
|---|---|---|---|
| Networking | Link congested | Interface exceeds throughput threshold (eg. 80% bandwidth) | See these alarms in action at our Live Demo. |
| Networking | High host traffic | Host consumed excessive throughput (eg. 20% interface bandwidth) | |
| System | Server overload | Server is overwhelmed (high pps), indicating a need for load balancing. | |
| System | Social Media abuse | User exceeded allowed amount of YouTube traffic per day (eg. 1GB) | |
| Security | DoS attack | Total flows are extremely higher than normal |
Read more about Traffic Alarms.
Volume alarms consume considerable amount of processing power, so we recommend you to optimize their usage by following next steps:
- Choose shorter time period (eg. 4h rather than 8h)
- Choose more specific scope and object when possible (eg. put End User "dale.carnegie" instead "Any")
- Remove alarms you don't actually need