System tab shows performance and system traffic for NetFlow module. Traffics available are:

  • UDP packets collected
  • Flows processed
  • Performance metrics
On this page:

UDP Packet Collected

UDP Packets show number of received and discarded packets. Viewing packet collection is useful for checking if your NetFlow Analyzer experienced some packet losses.

To access this view, go to Top N > System > UDP Packets.


NetVizura NetFlow - UDP packets collected


Discarded UDP packets mean that your buffer is full - some of the packets sent by exporters are not collected and will not be included as traffic information.

In some critical events such as network attack, having some amount of packet losses is acceptable.

It is up to you to decide much buffer memory to reserve in order to collect as much data as possible during overflows.

Flows Processed

Number of flows gives you statuses on the data processing. 

Flows are categorized into:

  • Processed - flows that are not filtered out, dropped or unlicensed
  • Filtered - flows not processed due to filters set in  > Settings > NetFlow Settings > Aggregator Filtering
  • Dropped - flows rejected due to full buffer
  • Unlicensed - flows not processed due to license limitation
  • Total stored - total number of flows received (processed + filtered + dropped)

To view flow processing, go to Top N > System > Flows.
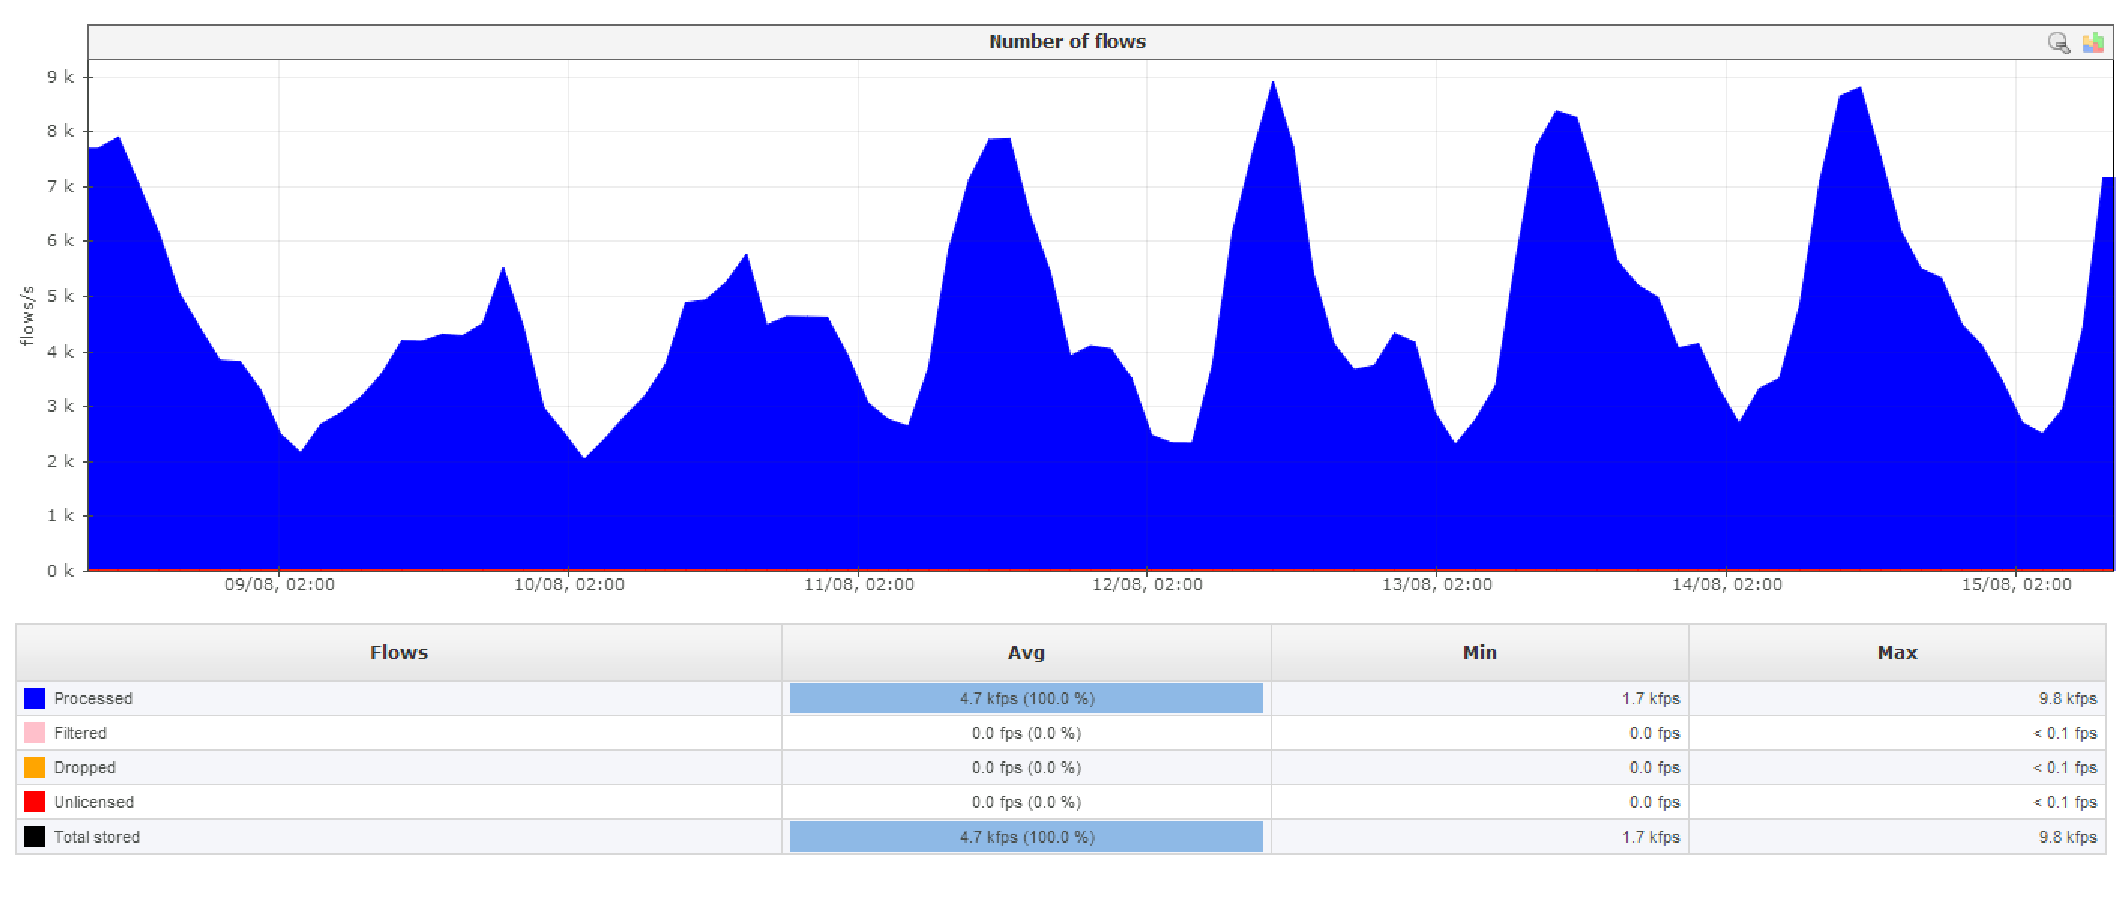
 

NetVizura NetFlow - flows processed


Dropped flows mean that your buffer is full - some of the packets sent by exporters are not collected and will not be included as traffic information.

Unlicensed flows (dark red on the graph) mean that your network devices are exporting more flows than your license allows.These flows will not be processed by aggregator and, therefore, information provided by them will not be included when creating and displaying traffic. In this case, you should upgrade your license. Read more about Upgrading License.


Performance Metrics

Within Performance overview you can see various metrics that show how efficient is your application.

Available metrics are:

  • Counters number - number of traffic monitoring counters (AS traffic, Service traffic etc.)
  • Nodes number - number of traffic monitoring nodes (exporters, interfaces, subnets, Traffic Patterns and Subnet Sets
  • DB write time - time spent on writing counters to the database
  • DB aggregation time - time spent on compacting the database (creating grains)
  • Alarm check time - time spent checking and triggering alarms
  • Heap memory use - memory use after traffic is written to the database


NetVizura NetFlow - performance metrics


Keep an eye on the Heap memory and how it is affected by the increase in monitored nodes and counters (each time you add a node or create a TopN rule this numbers are modified).


If you have insufficient memory on the server remember to consult with our post-installation guide on how to assign RAM to NetFlow services (Tomcat and PostgreSQL).
  • No labels