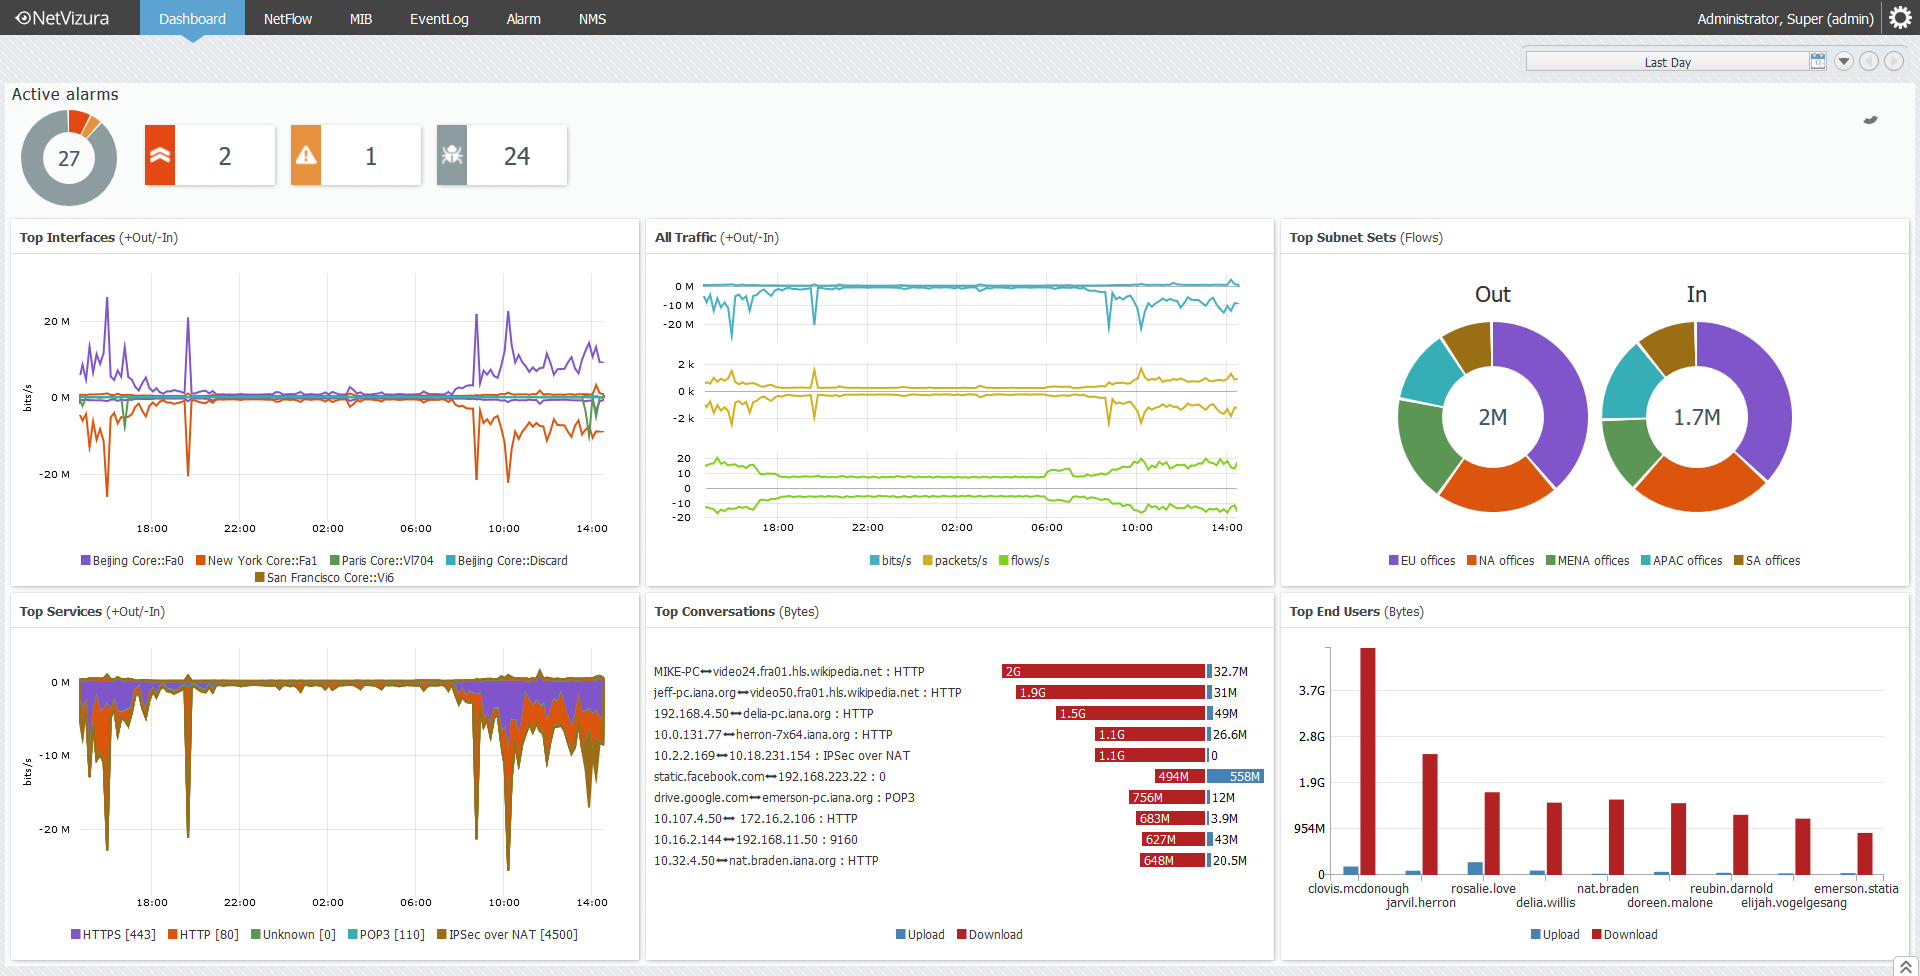
provides an overview of your network by showing Key Performance Indicators (KPIs) side-by-side in one place.

It is divided in two main sections:
- Active Alarms - indicating how many alarms are currently active by level (emergency, alert, critical, etc.)
- Dashlets - showing most important traffic nodes (all traffic, interfaces, services, conversations, users) and most recent alarms
Continue reading about Using Dashboard.