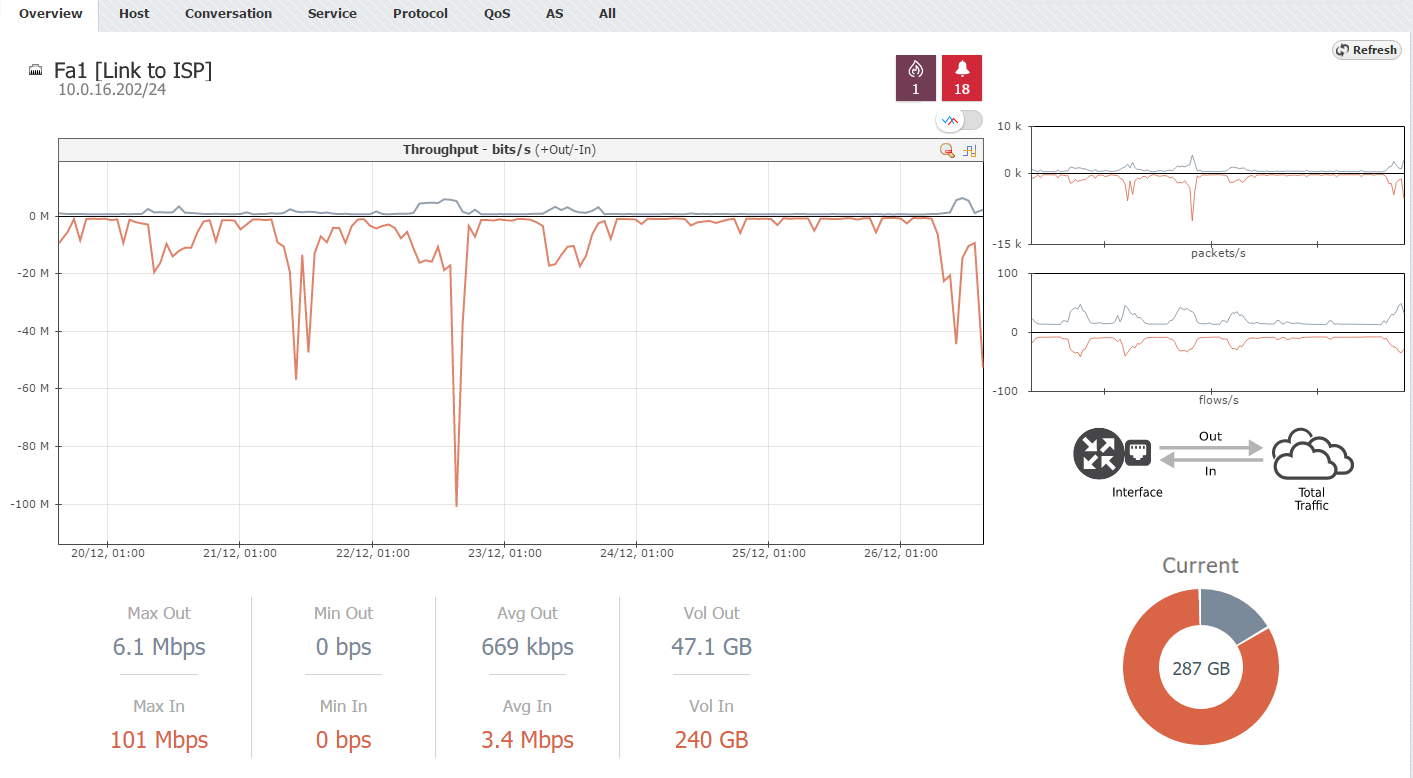
Overview is the first page you see when you select a node (exporter, interface, traffic pattern, etc.). It provides a quick glance on the traffic trend, volume, key performance indicators and active alarms for the selected time window.
Traffic Trend
Main line chart shows traffic throughput trend whereas bottom right donut chart shows traffic volume.
Indicators below the main chart show traffic maximum, minimum, average and volume.
Alarm cards above main chart provide number of alarms by severity with quick links to Alarm module for further investigation.

In the example above we see traffic overview for interface Fa1 (Link to ISP).
Main chart includes Out and In traffic throughput series clearly showing daily trend, peaks during working and valley during non-working hours. chart shows total traffic volume of 51.6 GB and ~15/85 Out/In traffic proportion.
Out traffic moved from 0 to 6.1 Mbps, in average was 669 kbps and in volume was 47.1 GB.
In traffic moved from 0 to 101 Mbps, in average was 3.4 Mbps and in volume was 240 GB.
This link has 1 emergency and 18 alert alarms that are currently active.