You can setup alarms to trigger if a specific condition is met on a Syslog or SNMP trap message:
- For Syslogs, threshold is based on source IP, severity, facility and message content
- For SNMP traps, threshold is based on source IP, trap OID and variable bindings.
 It is possible to combine more threshold criteria (AND logical operand is implied).
Each alarm has its severity and you can override the severity of the Syslog alarm. This is useful if the default severity of a Syslog does not correspond to alarm severity. For example, a fan is malfunctioning in the data center. Usually, Syslog severity for fan malfunctioning is Warning, but in this case it is wise to set the higher Alarm severity.
To view all EventLog alarms, go to Alarm Module.

Here you can see the list of all alarms that occurred within the selected time period. In our case, we can see different alarms that we previously defined in Settings.
In this view alarm occurrences are grouped. By clicking plus sign you can see each occurrence of an alarm. Occurrence indicators visualize approximate time (within selected time window) when alarm occurred. Clicking on Group toggle button alarm occurrences are no longer grouped.
You are also able to filter, sort alarms and view only active alarms according to your need.
Alarm is defined as group alarm (alarm will be triggered if all conditions are fulfilled for defined number of messages in defined time frame) it will have start time, and optionally end time if isn't deactivated yet. More precisely, if group alarm doesn't have end time, there are still some Eventlog messages, recorded by application, that meet alarm conditions in defined period of time. This alarm will be deactivated when there are less messages than defined in previous period of time.
Note that application restart (Tomcat restart, application update or something similar) will also deactivate all active Eventlog alarms during application initialization. After that, all calculations for alarm conditions will start "from zero".
Items under Scope column are clickable, so you can click on Exporter and after that you will be redirected to EventLog module. During redirection global time-frame of application will be set to start date and end date of selected alarm or group of alarms. In parallel with that action, all header filters in EventLog module will be populated according to Alarm definition.
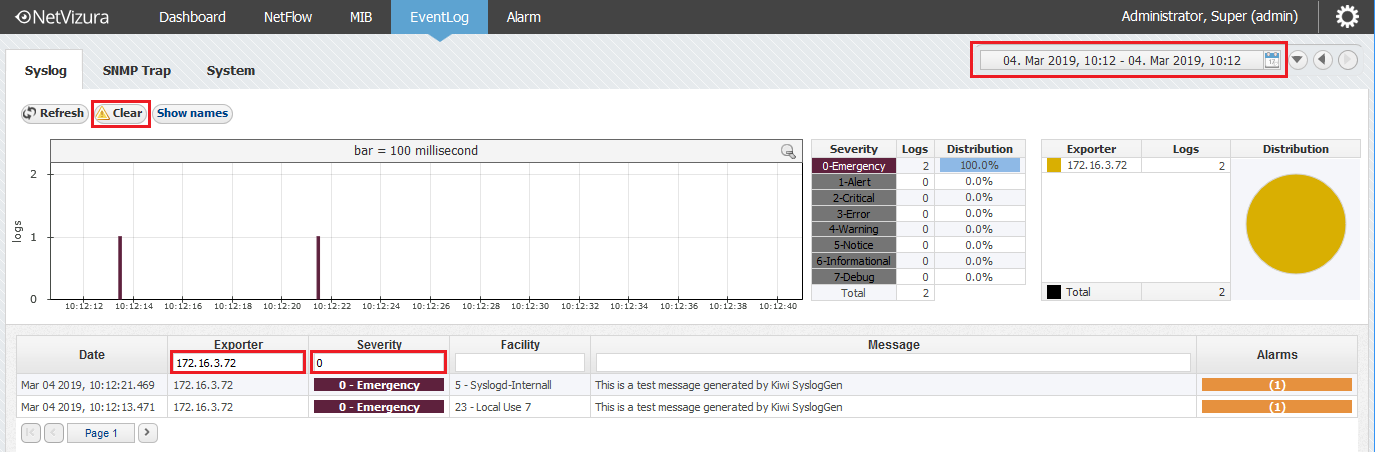
In following example alarm is defined to be triggered on Syslog messages with Emergency Severity level. Two Syslog messages received from same exporter activated this alarm. Click on exporter in Alarm module redirects user to EventLog module and sets time-frame to minute when messages occurred. Filters for Exporter and Severity are populated also.
Learn more
Learn about creating EventLog Alarms in Alarm Settings (ELA).
When you are redirected from Alarm module to EventLog module, Clear button will have visible info icon. Click on Clear button will reset all filters and reload all messages in selected time-frame.
After clearing all filters on Clear button, you have to manually set time-frame (Clear button has no effect on time-frame)