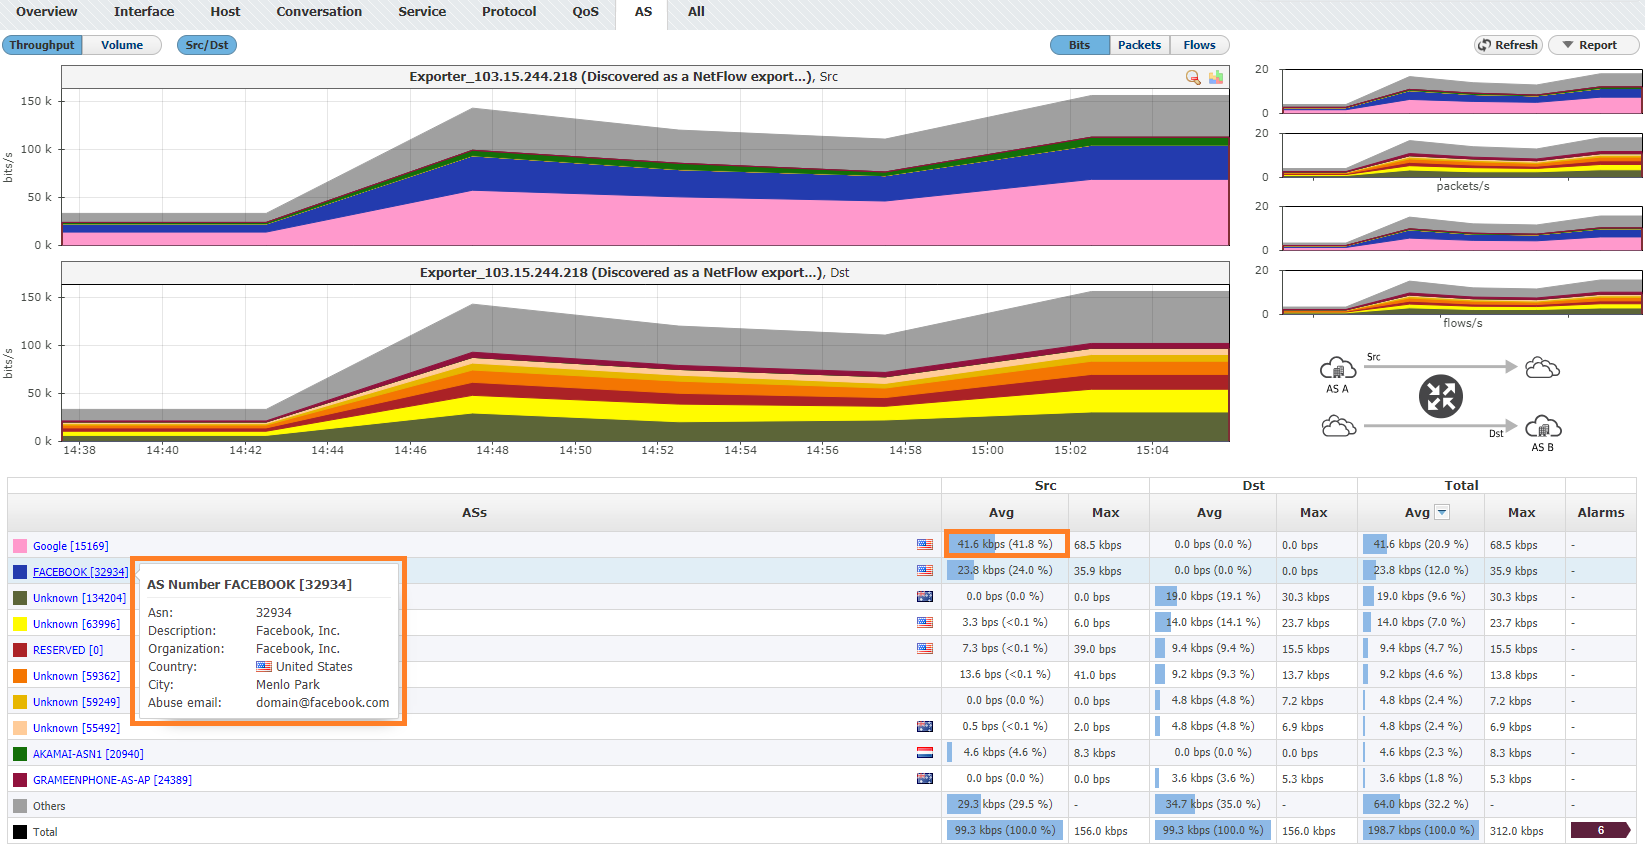
Distribution by AS shows specific traffic by autonomous systems. It allows comparison of the AS traffic volume, watching trends and level of AS traffic in use (for example, when the traffic towards Facebook is at the highest level), and monitoring if employees generate forbidden traffic (Google, Facebook, YouTube, etc.).
To view traffic distribution by AS:
- Choose a section (Exporters, Traffic Patterns or End Users) in the Menu Panel
- Select desired node in the Node Tree
- Choose AS in the Tab panel

Besides that, if you over some AS, you can see that significantly saves time, improves readability of the statistics and increases overall contextual awareness.