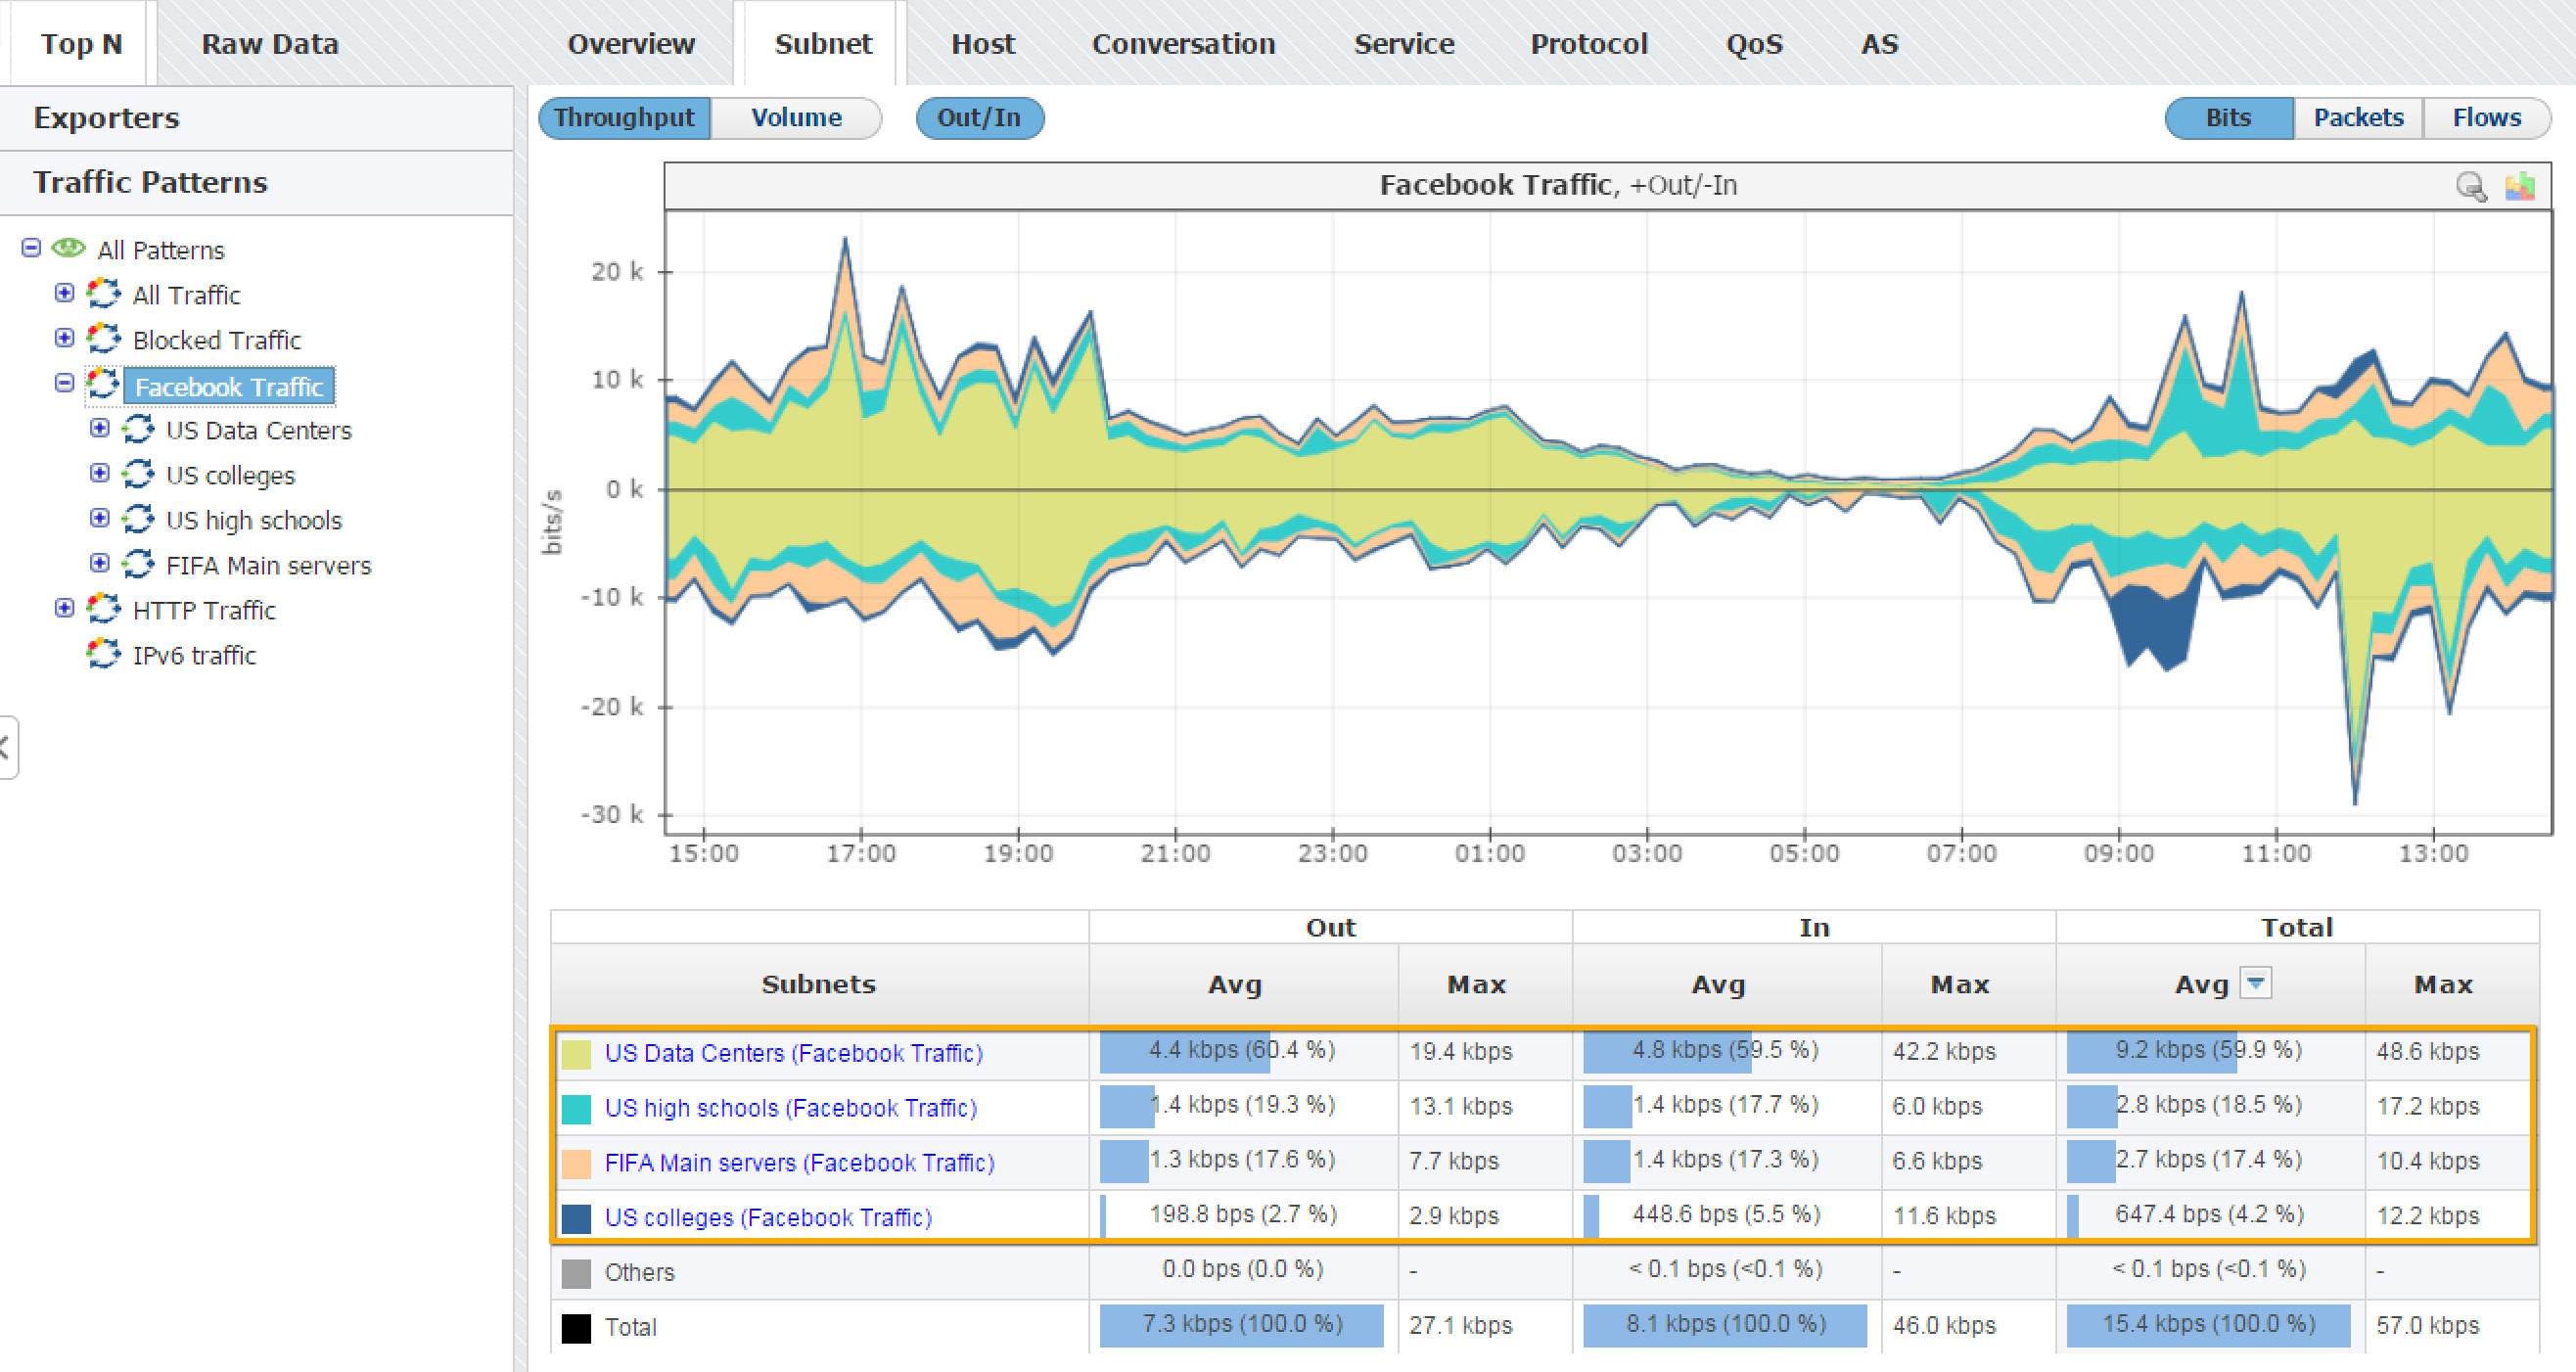
Traffic Pattern view presents statistic for the specific Traffic Pattern you have previously configured.
To show statistic for a Traffic Pattern, go to TopN > Traffic Patterns option and select the node of your interest.

The Navigation Tree in the Menu Panel shows Traffic Patterns and their Subnets, while Main Panel shows traffic data for for the selected Traffic Pattern (throughput or volume, in bits, packets or flows) or its subnet. Clicking on any tab option will show traffic distribution by that category (e.g. clicking on the Subnets tab will give you top Subnets for the selected Traffic Pattern).
Figure above shows traffic statistic for the Facebook Traffic. You can see that US Data Centers subnet takes the most of Facebook Traffic, followed by US high schools and FIFA Main servers, whereas US colleges subnet takes the least.