| Name
|
Size
|
Creator |
Creation Date
|
Last Modification Date
|
Labels |
Attached To |
|
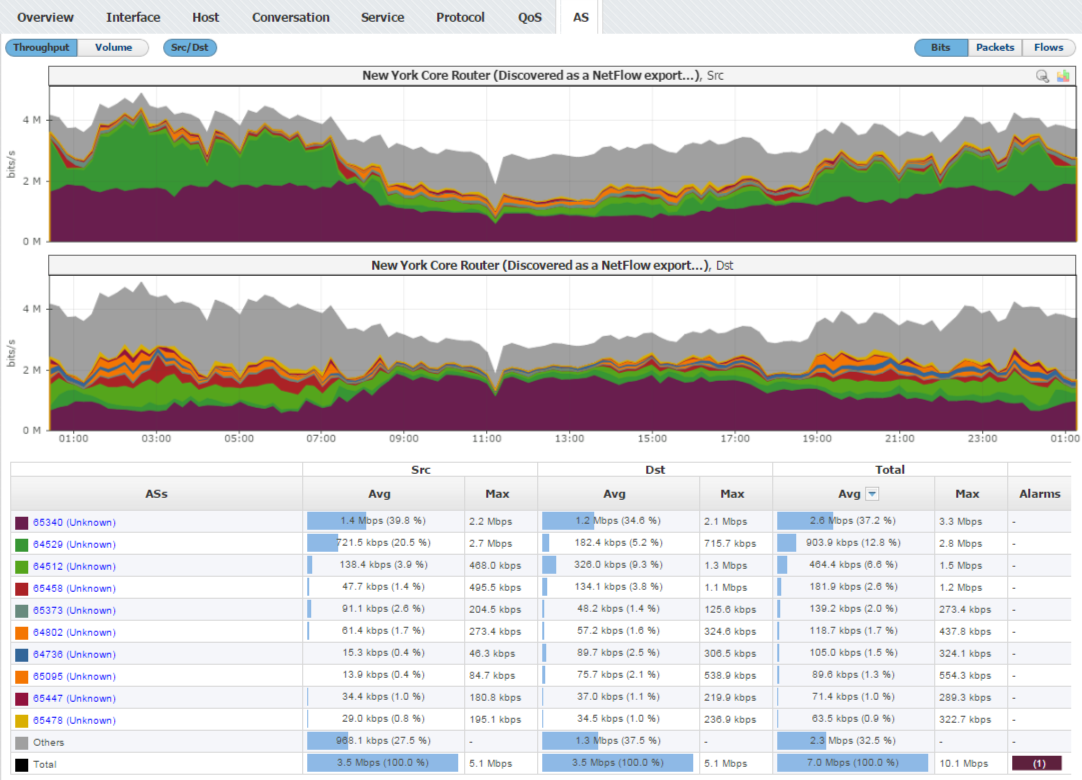
PNG File NetFlow Distribution by AS.png |
331 kB |
Vladimir Stanković |
19 Nov, 2015 16:14 |
26 May, 2016 15:23 |
|
Page: Distribution by AS
|
|
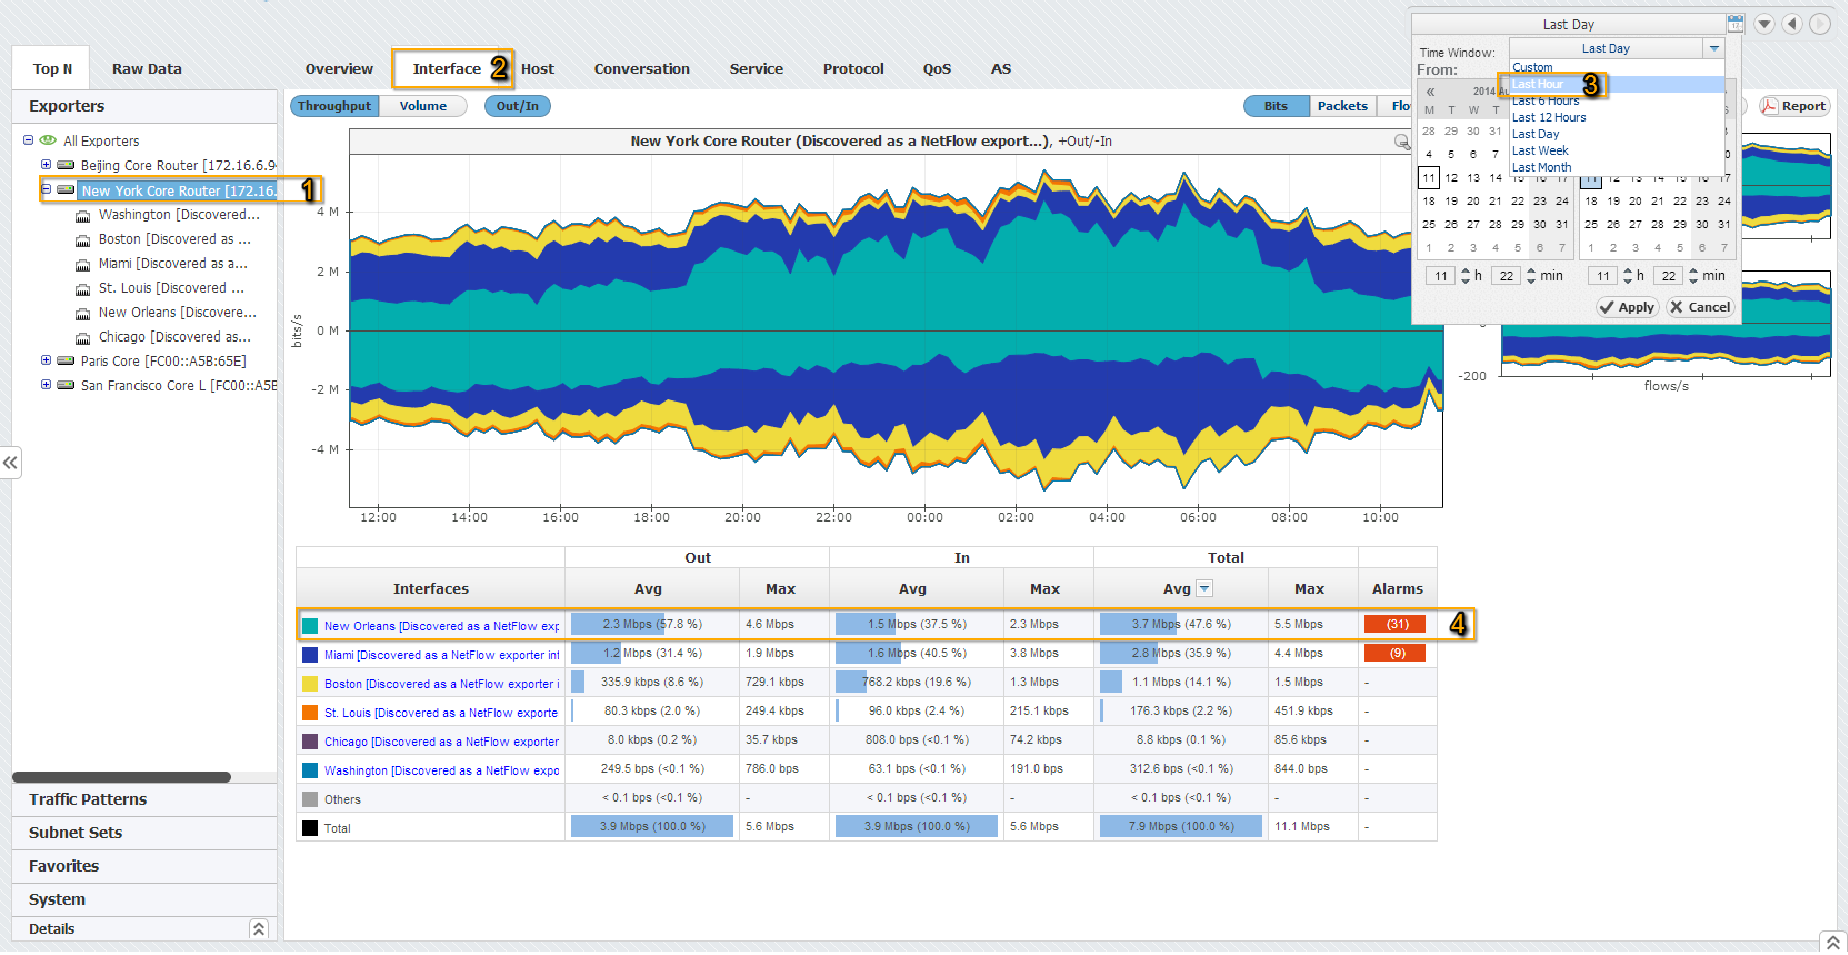
PNG File jira-capture-screenshot-20140811-112311-113.png |
300 kB |
Vladimir Stanković |
19 Nov, 2015 16:14 |
26 May, 2016 15:23 |
|
Page: Distribution by Interfaces
|
|
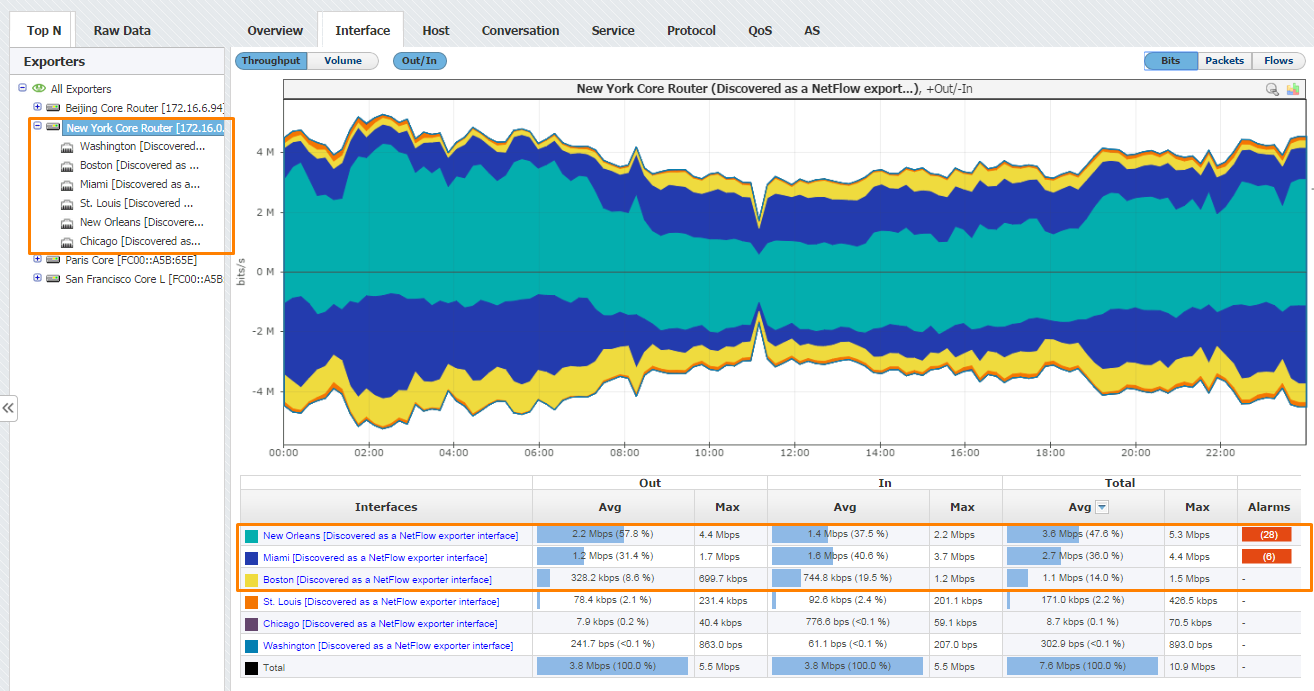
PNG File NetFlow Exporter by Interfaces.png |
196 kB |
Vladimir Stanković |
19 Nov, 2015 16:14 |
26 May, 2016 15:23 |
|
Page: Distribution by Interfaces
|
|
PNG File NetFlow Exporter by Interface.png |
196 kB |
Vladimir Stanković |
19 Nov, 2015 16:14 |
26 May, 2016 15:23 |
|
Page: Distribution by Interfaces
|
|
PNG File NetVizura NetFlow Exporter by Interface.png |
196 kB |
Vladimir Stanković |
19 Nov, 2015 16:14 |
26 May, 2016 15:23 |
|
Page: Distribution by Interfaces
|
|
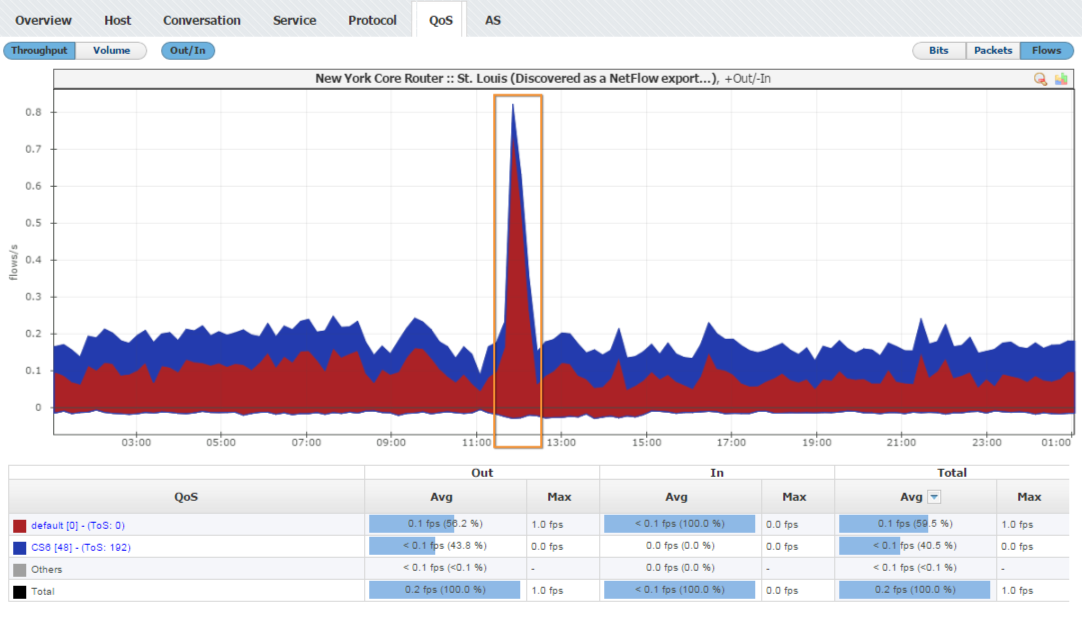
PNG File NetFlow Distribution by QoS.png |
155 kB |
Vladimir Stanković |
19 Nov, 2015 16:14 |
26 May, 2016 15:23 |
|
Page: Distribution by QoS
|
|
PNG File NetFlow Drill-Down.png |
173 kB |
Vladimir Stanković |
19 Nov, 2015 16:14 |
26 May, 2016 15:23 |
|
Page: Using Charts and Tables
|
|
PNG File NetFlow Highlight.png |
190 kB |
Vladimir Stanković |
19 Nov, 2015 16:14 |
26 May, 2016 15:23 |
|
Page: Using Charts and Tables
|
|
PNG File NetFlow Isolation.png |
221 kB |
Vladimir Stanković |
19 Nov, 2015 16:14 |
26 May, 2016 15:23 |
|
Page: Using Charts and Tables
|
|
PNG File Drill-down-1.png |
189 kB |
Vladimir Stanković |
19 Nov, 2015 16:14 |
26 May, 2016 15:23 |
|
Page: Using Charts and Tables
|
|
PNG File drill-down-2.png |
179 kB |
Vladimir Stanković |
19 Nov, 2015 16:14 |
26 May, 2016 15:22 |
|
Page: Using Charts and Tables
|
|
PNG File isolation-1.png |
82 kB |
Vladimir Stanković |
19 Nov, 2015 16:14 |
26 May, 2016 15:22 |
|
Page: Using Charts and Tables
|
|
PNG File isolation-2.png |
70 kB |
Vladimir Stanković |
19 Nov, 2015 16:14 |
26 May, 2016 15:22 |
|
Page: Using Charts and Tables
|
|
PNG File NetFlow Throughput Chart.png |
89 kB |
Vladimir Stanković |
19 Nov, 2015 16:14 |
26 May, 2016 15:22 |
|
Page: Using Charts and Tables
|
|
PNG File NetFlow Throughput Views.png |
82 kB |
Vladimir Stanković |
19 Nov, 2015 16:14 |
26 May, 2016 15:22 |
|
Page: Using Charts and Tables
|
|
PNG File NetFlow Volume Chart.png |
34 kB |
Vladimir Stanković |
19 Nov, 2015 16:14 |
26 May, 2016 15:22 |
|
Page: Using Charts and Tables
|
|
PNG File jira-capture-screenshot-20140811-115124-770.png |
264 kB |
Vladimir Stanković |
19 Nov, 2015 16:14 |
26 May, 2016 15:22 |
|
Page: Using Charts and Tables
|
|
PNG File jira-capture-screenshot-20140811-115808-006.png |
184 kB |
Vladimir Stanković |
19 Nov, 2015 16:14 |
26 May, 2016 15:22 |
|
Page: Using Charts and Tables
|
|
PNG File jira-capture-screenshot-20140811-120225-533.png |
523 kB |
Vladimir Stanković |
19 Nov, 2015 16:14 |
26 May, 2016 15:22 |
|
Page: Using Charts and Tables
|
|
PNG File jira-capture-screenshot-20140811-120509-212.png |
898 kB |
Vladimir Stanković |
19 Nov, 2015 16:14 |
26 May, 2016 15:22 |
|
Page: Using Charts and Tables
|