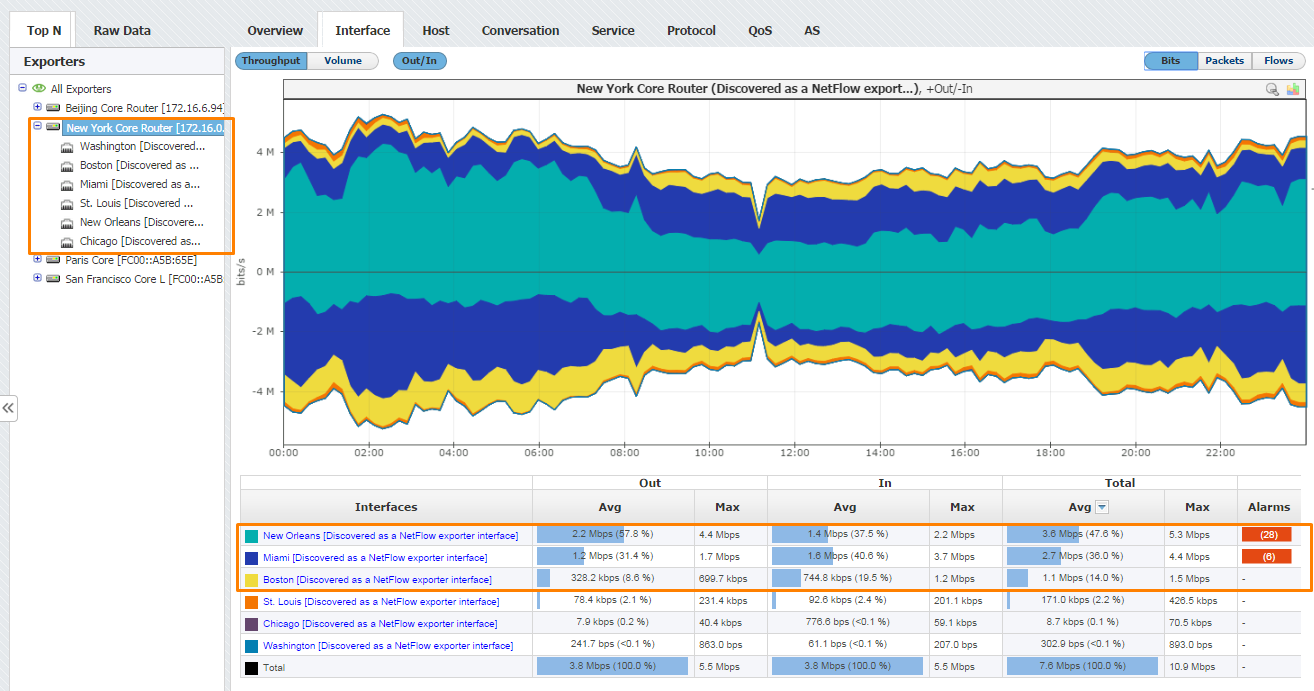
Distribution of traffic by interfaces is available for Exporter node only. It shows how network traffic that passed through the selected exporter is distributed to its interfaces and which interfaces are top bandwidth consumers. This is useful if you want to look into how much exporter traffic has passed through specific interface (in total, In and Out directions).
To view exporter traffic distribution by interface:
- Select an exporter from Navigation Tree in the Menu Panel
- Select Interface tab in Tab Panel
The Menu Panel Navigation Tree presents interfaces belonging to the selected exporter. Main Panel shows throughput or volume chart and table statistics for bits, packets or flows for the selected Time Window. Note that top talkers for bits, packets and flows can differ (e.g. a top talker by flows may not be a top talker by bits).

Screenshot above gives an example of exporter traffic distribution by interface for the exporter named New York Core router. From six interfaces of the New York Core router, the top talkers by bits are: New Orleans, Miami and Boston interfaces. You can also see that more than 90% of all traffic passing through the New York Core router passes through these three interfaces.